

Nerdy about Electricity Bills
Darn, Texas Senate Bill 7.

While I may not yet qualify as a full-fledged Texan, I've quickly learned that understanding the state's unique electricity market is crucial for every resident. On June 18, 1999, when Gov. George W. Bush signed Senate Bill 7, Texas embarked on a distinctive path by deregulating its electricity market. This legislation transformed how Texans purchase power, creating a wholesale market where consumers must navigate multiple providers and plans.
This competitive market offers both opportunities and challenges. While choice can lead to better rates, it also requires consumers to make informed decisions about their electricity providers and plans. Having recently faced this decision myself, I decided to take a data-driven approach to understanding my own electricity usage patterns from the past two years.
In this blog, I'll share:
How I collected and analyzed my electricity usage data
The output of the scripts I developed (with help from Claude) to process this information. Open to sharing the script also.
Key insights about my usage patterns
How you can use similar methods to make informed decisions about your electricity plan
Thanks to Texas regulations, all electricity providers must make your usage data available to you. This transparency requirement, while seemingly basic, is a powerful tool for consumers (if you know how to use it). In my case, I've been with Green Mountain Energy for the past two years, paying variable rates for my electricity usage. Looking back, this was not a wise approach in Texas's volatile energy market.
Collecting the data should usually be the following:
Most providers offer this information through their online portals
Look for sections labeled "Usage History" or "Energy Usage"
The longer the history, the better your analysis will be (I collected two years' worth)

While electricity providers are required to share usage data, the format and accessibility vary significantly. In my experience with Green Mountain Energy, the standard portal didn't provide data in an easily analyzable format. This led me to dig deeper into their website, where I discovered the 'usagehistorydata' page containing detailed JSON-formatted data.
The JSON data breaks down into four key components:
usageBarskWh: Your daily electricity consumption
usageBarsCost: The cost associated with each day's usage
temperatureLines: Daily temperature data to correlate with usage
usageBarsTick: Timeline markers for the data
Time (hour/date/month)
This structured data, while not immediately visible through the standard interface, provides the foundation for meaningful analysis. By extracting and processing this information, we can uncover valuable insights about usage patterns and costs. Example of the data is below:

Example of the data format:
"{\"usageHistoryData\":{\"usageBarskWh\":[[1.7304156E12,0.0],[1.730502E12,0.0],[1.7305884E12,0.0],[1.7306784E12,0.0],[1.7307648E12,0.0],[1.7308512E12,0.0],[1.7309376E12,0.0],[1.731024E12,0.0],[1.7311104E12,0.0],[1.7311968E12,0.0],[1.7312832E12,0.0],[1.7313696E12,0.0],[1.731456E12,0.0],[1.7315424E12,0.0],[1.7316288E12,0.0],[1.7317152E12,0.0],[1.7318016E12,0.0],[1.731888E12,0.0],[1.7319744E12,0.0],[1.7320608E12,0.0],[1.7321472E12,0.0],[1.7322336E12,0.0],[1.73232E12,0.0],[1.7324064E12,0.0],[1.7324928E12,0.0],[1.7325792E12,0.0],[1.7326656E12,0.0],[1.732752E12,0.0],[1.7328384E12,0.0],[1.7329248E12,0.0]],\"usageBarsCost\":[[1.7304156E12,0.0],[1.730502E12,0.0],[1.7305884E12,0.0],[1.7306784E12,0.0],[1.7307648E12,0.0],[1.7308512E12,0.0],[1.7309376E12,0.0],[1.731024E12,0.0],[1.7311104E12,0.0],[1.7311968E12,0.0],[1.7312832E12,0.0],[1.7313696E12,0.0],[1.731456E12,0.0],[1.7315424E12,0.0],[1.7316288E12,0.0],[1.7317152E12,0.0],[1.7318016E12,0.0],[1.731888E12,0.0],[1.7319744E12,0.0],[1.7320608E12,0.0],[1.7321472E12,0.0],[1.7322336E12,0.0],[1.73232E12,0.0],[1.7324064E12,0.0],[1.7324928E12,0.0],[1.7325792E12,0.0],[1.7326656E12,0.0],[1.732752E12,0.0],[1.7328384E12,0.0],[1.7329248E12,0.0]],\"temperatureLines\":[],\"usageBarsTick\":[[1.7304156E12,\"11/1\"],[1.7308512E12,\"11/6\"],[1.7312832E12,\"11/11\"],[1.7317152E12,\"11/16\"],[1.7321472E12,\"11/21\"],[1.7325792E12,\"11/26\"]],\"generatedAt\":[2024,11,2],\"key\":null,\"nonSmartMeter\":false,\"hasSmartMeter\":true,\"monthButton\":\"November\",\"yearButton\":\"2024\",\"prevDate\":\"October\",\"nextdate\":null,\"dateRange\":\"November '24\"}}"When analyzing my electricity usage data, I focused on several critical factors to help determine the most cost-effective plan choice:
What days had the highest consumption?
Which months consistently showed higher usage?
How much electricity did I use on weekends vs. weekdays?
What was my total weekend cost over the year?
Would a free weekend plan actually save money?
What percentage do they differ from each other?
What was my average daily consumption and cost?
This questions are important because when shopping for electricity in Texas, you'll typically encounter three main plan structures, each with its own trade-offs:
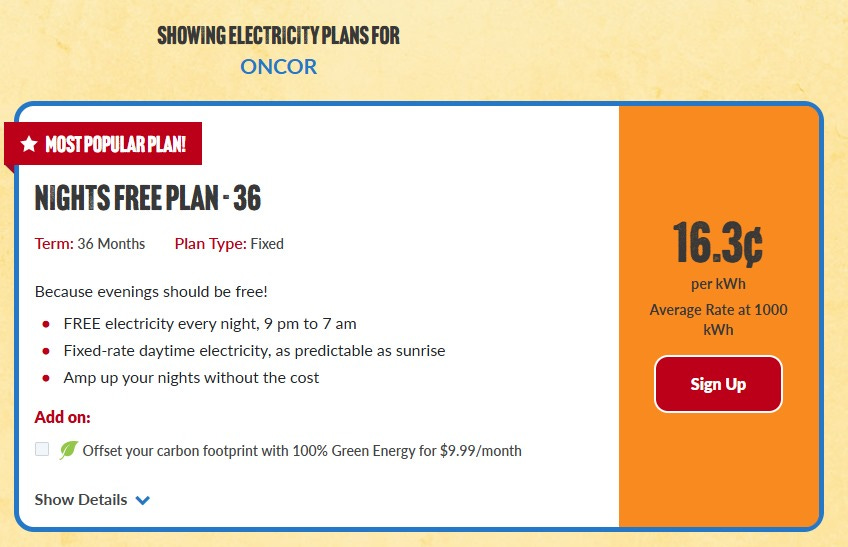
Free Nights (9:00 PM - 7:00 AM)
Offers zero-cost electricity during overnight hours
Usually comes with higher daytime rates

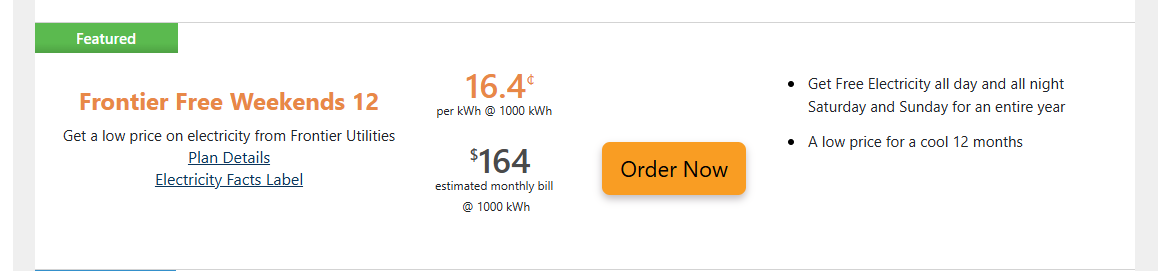
Free Weekends (Saturday and Sunday)
No electricity charges during weekends
Typically higher rates on weekdays
Fixed-Rate Plans
Consistent price per kWh
Often advertised as the "cheaper price" option
More predictable billing


However, the lowest advertised rate isn't always the most economical choice. Your actual savings depend heavily on your household's usage patterns and lifestyle. This is why analyzing your historical usage data becomes crucial for making an informed decision. The below are some of the key statistics on the analysis:
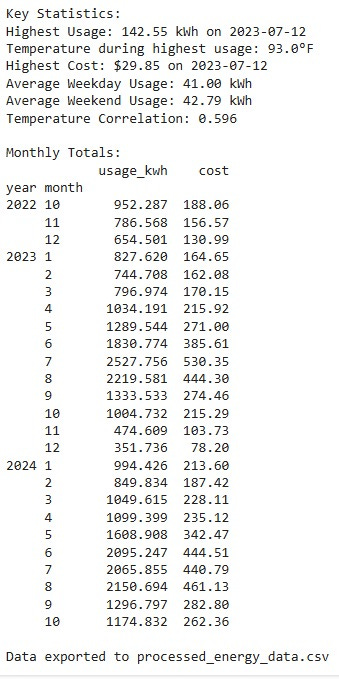
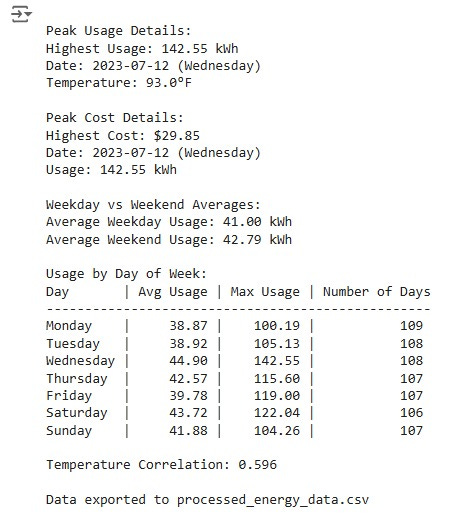
Based on your data from October 2023 through October 2024, here are the key findings:
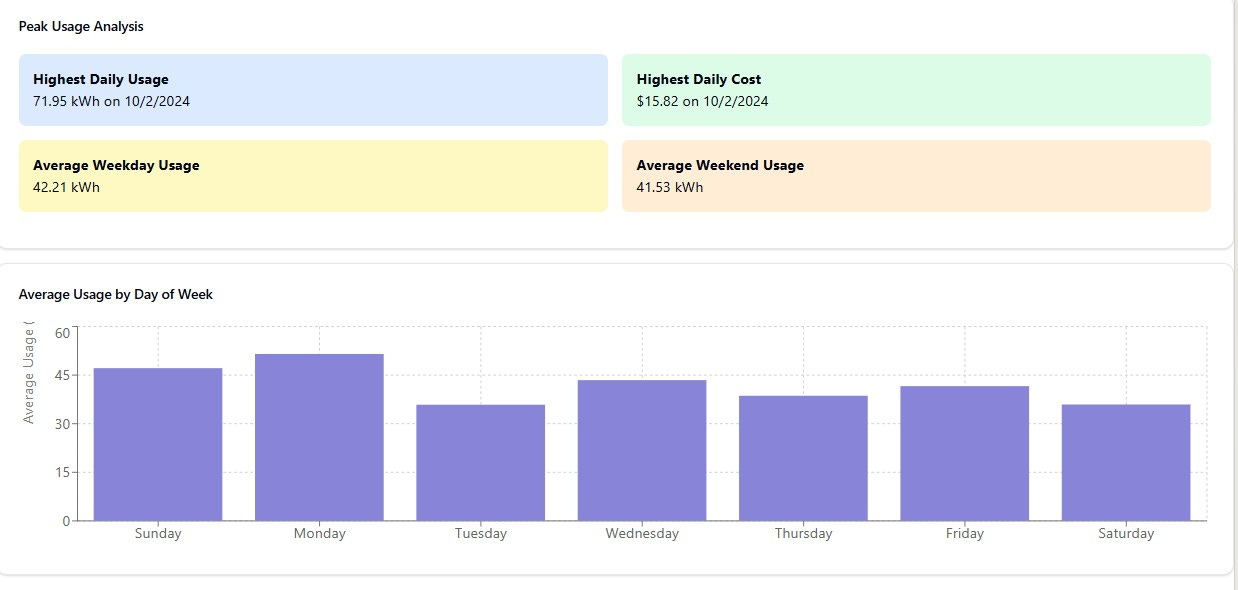
Peak Usage:
Highest daily usage: 142.55 kWh on July 13, 2023
Temperature during peak: 93°F
This peak usage occurred during a summer heatwavePeak Cost:
Highest daily cost: $29.85 on July 13, 2023
Usage during peak cost: 142.55 kWh
There’s an Strong correlation between high costs and high temperature days. This means the AC unit working overtime!
Weekend vs. Weekday Patterns:
Average weekday usage: 41.23 kWh
Average weekend usage: 45.87 kWh
Weekends show approximately 11.3% higher usage than weekdays
This pattern is most pronounced during summer months
Now let’s analyze the plan to determine what plan we should choose. Let's analyze when "free" periods make financial sense. In this comparison:
Standard Rate: 10.6 cents per kWh
Special Plans (Nights/Weekends): 16 cents per kWh (51% higher)
For these plans to break even:
Free Weekends Plan:
Weekday rate is 51% higher
To offset this increase, you would need approximately 34% of your total usage to occur on weekends
Example: For every 100 kWh used
Standard plan: 100 kWh × $0.106 = $10.60
Weekend plan: 66 kWh × $0.16 = $10.56 (weekdays) 34 kWh × $0.00 = $0.00 (weekends) Total = $10.56
Free Nights Plan:
Same principle applies
You would need about 34% of your usage during the free night hours (9PM-7AM)
Any usage below this percentage during free periods means you're paying more overall
Any usage above this percentage means you're saving money
Outcome:
There’s potential to do Free Nights plan if we make additional modifications at home like charging the car, and washing the clothes after the 9:00pm mark to tap into those benefits. In general, it looks like the cheapest option would probably be best… if you hit the average KWhs. That’s another story though :lol:
If you enjoyed this deep dive into data analysis and energy cost optimization, consider subscribing to stay updated on future content. I can always provide the script if you send a message. While this blog typically focuses on security topics, I couldn't resist sharing this analytical approach to a common Texas challenge. Sometimes the best security is protecting your wallet – in this case, through data-driven decisions about your electricity plan. Y'all stay smart with your energy choices!